
100/100
HTTPS worked during testing
Northern digital research by Rovidx
What 100 Northwest Territories websites reveal about mobile performance, accessibility, search readiness and digital reliability.
Executive overview
The benchmark found a strong foundation—particularly universal HTTPS and widespread contact clarity—alongside substantial opportunities involving mobile speed, usability and automated accessibility findings.
HTTPS worked, HTTP redirected to HTTPS and certificates were current on all 100 final benchmark sites. A contact method was discoverable on 94 of 100 sites, and most homepages also made their purpose and a next step clear.
The largest shared opportunities were in mobile interaction, loading performance and automated accessibility screening. The median mobile Lighthouse performance score was 66, median laboratory Largest Contentful Paint was 8.5 seconds, and axe detected at least one critical or serious rule on 93 of 100 sites. These are screening observations, not proof of legal non-compliance.
The internal Digital Readiness Baseline had a median of 73.51 out of 100. The score is intended for aggregate interpretation and is not a formal certification or public leaderboard.
Headline findings
Eight summary measures from the automated 100-site homepage benchmark. Individual organization scores are not published.
100/100
HTTPS worked during testing
94/100
Provided a contact method and clear next step
66
Median Lighthouse mobile performance score
8.5 seconds
Median mobile lab Largest Contentful Paint
3.22 MiB
Median transferred page weight
16/100
Met the study’s mobile target-size threshold
93/100
Triggered at least one critical or serious axe rule
73.51/100
Median overall digital-readiness score
Axe results are automated screening observations. They do not mean websites “failed accessibility,” violated the law, or failed a WCAG conformance determination.
Charts
Publication-ready charts from the final analysis. Each figure includes a plain-language interpretation and a text table equivalent.
Distribution of the Digital Readiness Baseline across 100 benchmark sites. Median 73.51; interquartile range 68.88–77.93.
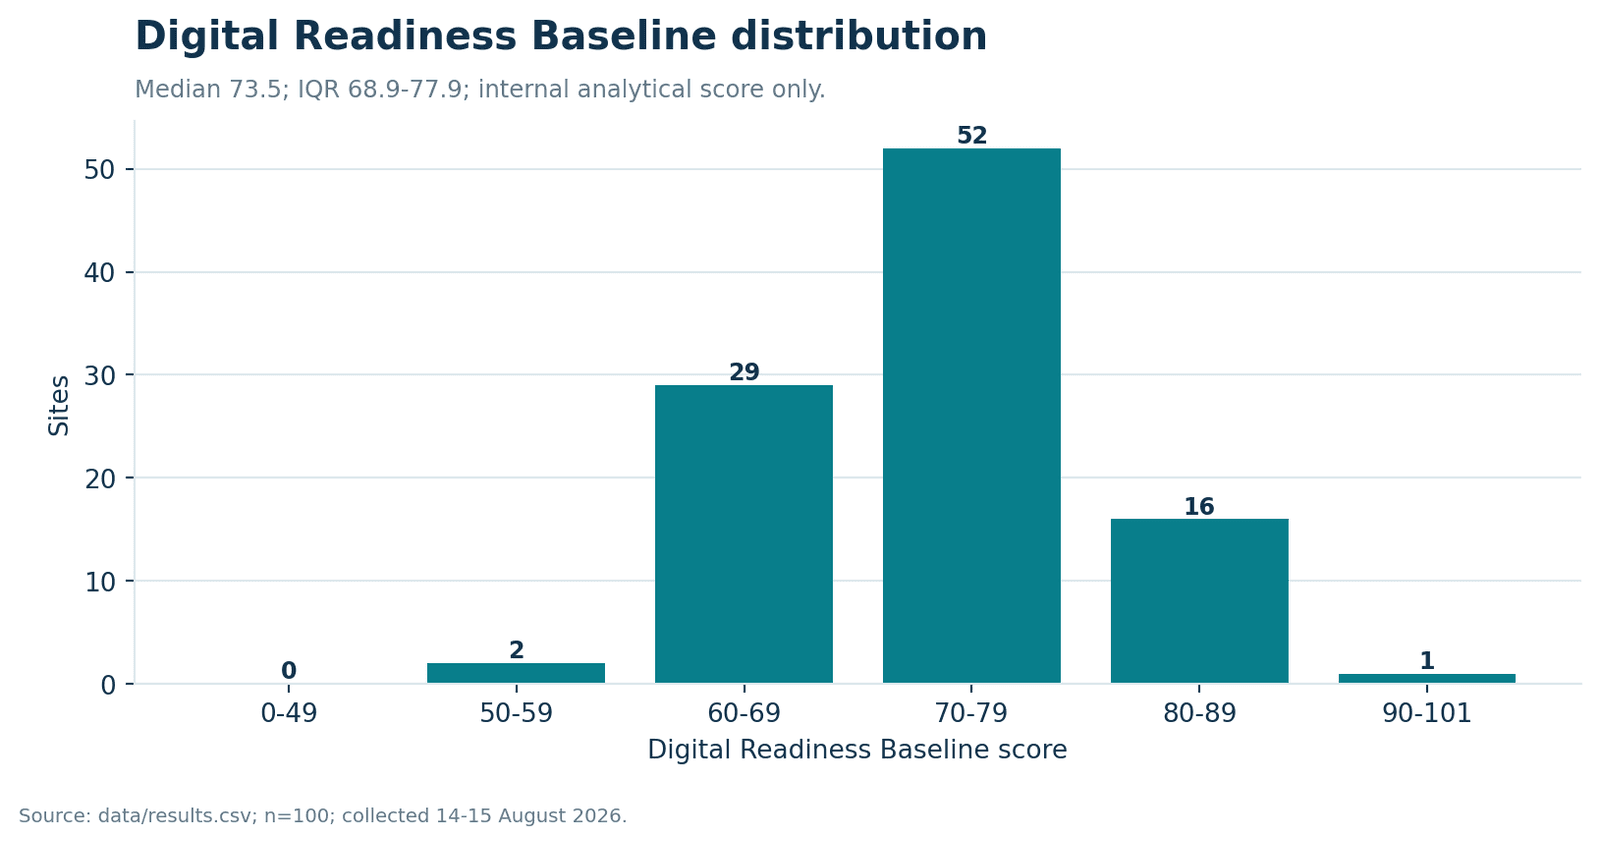
Interpretation: Most sites clustered in the 70–79 band. The score is an aggregate readiness baseline for interpretation—not a ranking or certification.
| Score band | Sites |
|---|---|
| 0–49 | 0 |
| 50–59 | 2 |
| 60–69 | 29 |
| 70–79 | 52 |
| 80–89 | 16 |
| 90–101 | 1 |
Relationship between transferred page weight and median mobile Lighthouse performance. Spearman association −0.54.
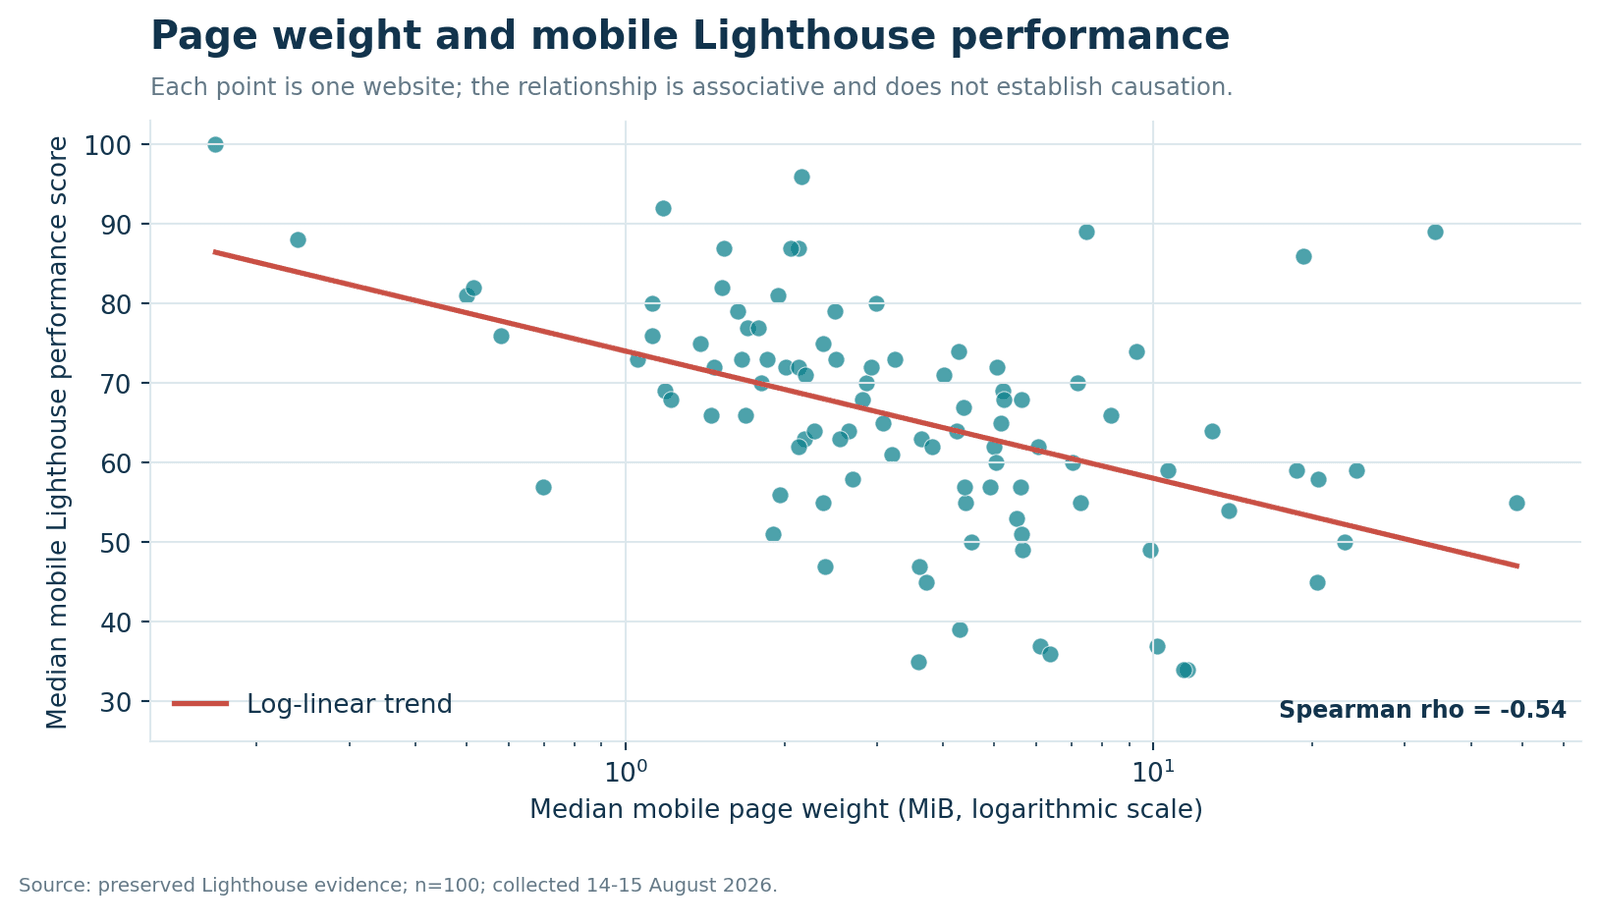
Interpretation: Heavier pages were generally associated with weaker mobile lab performance. Median page weight was 3.22 MiB and the median performance score was 66. The association does not establish causation.
| Metric | Value |
|---|---|
| Median mobile page weight | 3.22 MiB |
| Median mobile Lighthouse performance | 66 |
| Spearman association (weight vs performance) | −0.54 |
Most frequent axe-core rules among the 100 homepage audits. Automated screening only—not a WCAG conformance determination.
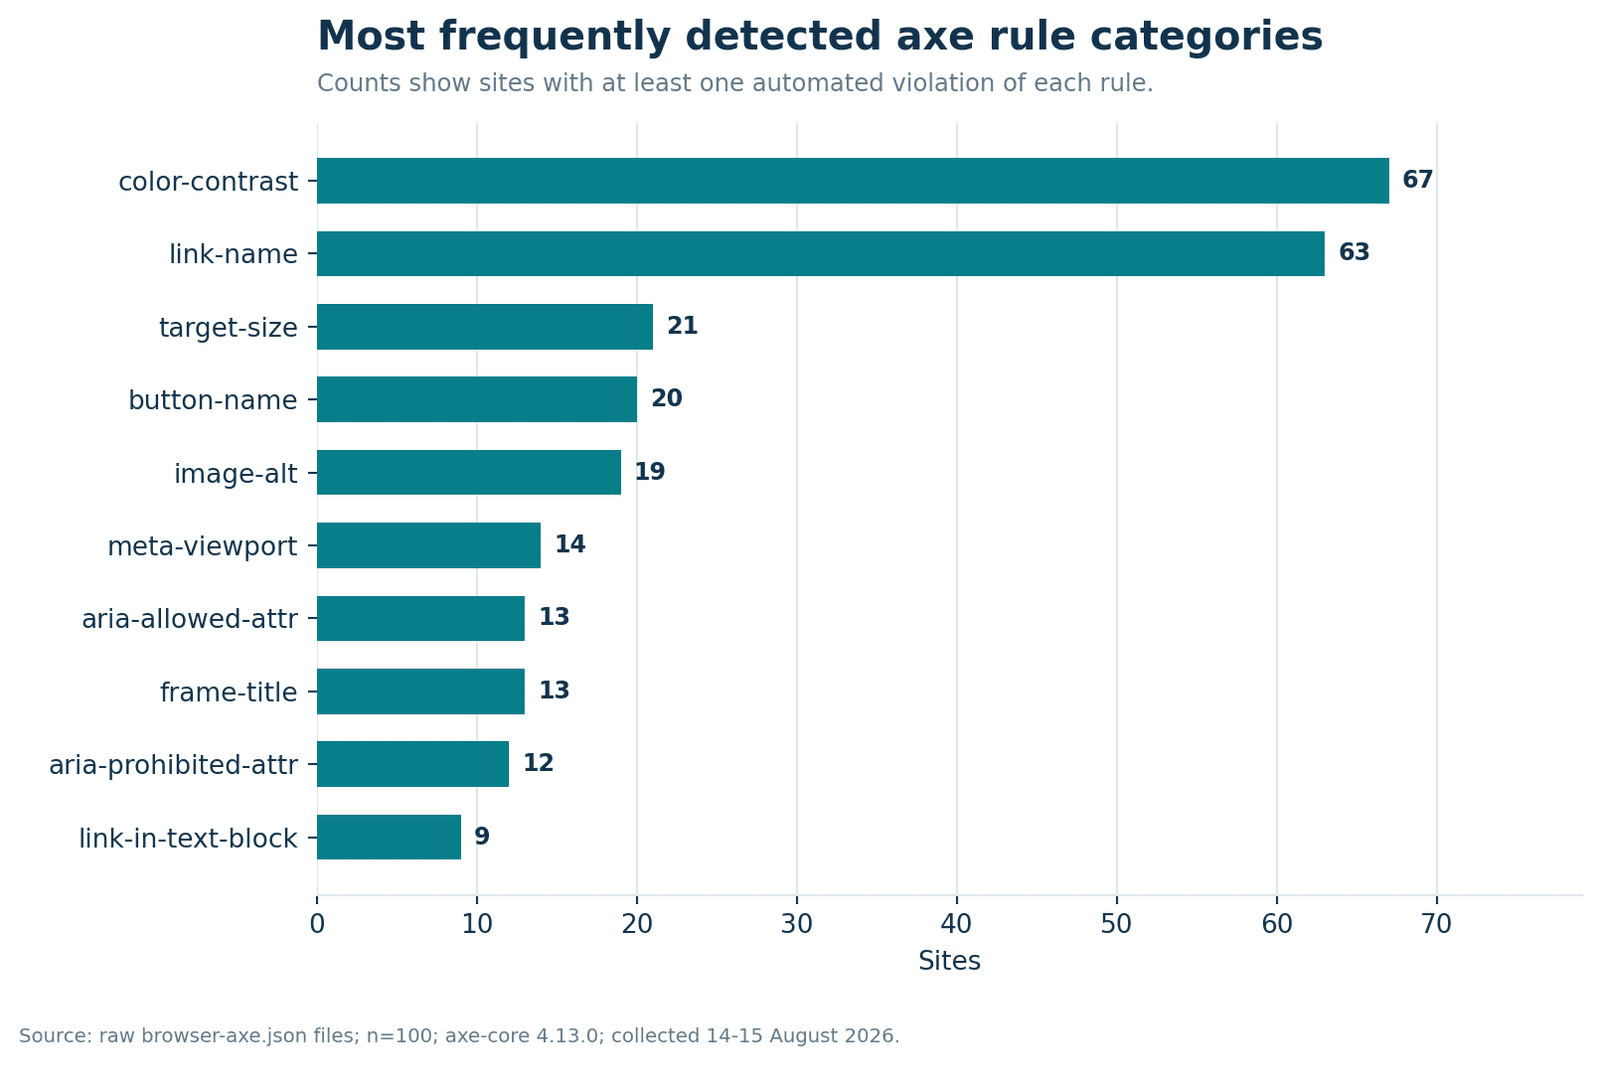
Interpretation: Colour-contrast rules appeared on 67 sites and link-name rules on 63. Axe results are automated screening observations; they do not establish legal compliance or WCAG conformance.
| Rule | Sites |
|---|---|
| Colour contrast | 67 |
| Link name | 63 |
| Target size | 21 |
| Button name | 20 |
| Image alt | 19 |
| Meta viewport | 14 |
| ARIA allowed attribute | 13 |
| Frame title | 13 |
| ARIA prohibited attribute | 12 |
| Link in text block | 9 |
Key findings
Ten themes drawn directly from the final report. Wording stays constructive and aggregate—no organization-level scores.
Finding 1
HTTPS worked on 100 of 100 sites. HTTP redirected to HTTPS on all 100, and all tested certificates were current.
Finding 2
A contact method was discoverable on 94 of 100 sites, a clear next step on 94, an observable purpose signal on 93 and a community or service-location signal on 89.
Finding 3
The median mobile Lighthouse performance score was 66; only 3 sites scored from 90 to 100, while 13 scored below 50. These are controlled lab results, not direct measurements of real user experience.
Finding 4
Median mobile page weight was 3.22 MiB, and page weight had a Spearman correlation of −0.54 with Lighthouse performance. This association does not establish causation.
Finding 5
Only 16 of 100 sites met the study’s threshold that at least 90% of sampled primary controls measure at least 24 by 24 CSS pixels. Mobile navigation worked under the protocol on 60 sites.
Finding 6
The median Lighthouse accessibility score was 88, but axe detected at least one critical or serious rule on 93 sites. Colour-contrast rules appeared on 67 sites and link-name rules on 63.
Finding 7
HSTS and X-Content-Type-Options appeared on 48 sites each, frame protection on 32, Content-Security-Policy on 15, Referrer-Policy on 15 and Permissions-Policy on 11. Missing headers are hygiene opportunities, not proof of vulnerabilities.
Finding 8
Passive fingerprinting identified WordPress on 46 sites, Wix on 13 and Drupal on 11; 22 remained unknown. These detections are probable rather than guaranteed.
Finding 9
Tourism and hospitality accounted for 77 of 100 benchmark sites, reflecting the available website pool rather than the NWT economy overall.
Finding 10
No individual rankings or organization-level scores are published. The value of the study is a repeatable aggregate baseline, not a leaderboard.
Practical recommendations
General recommendations based on aggregate findings—not criticism of any audited organization.
Recommendation 1
Compress and resize images, reduce unnecessary scripts and retest mobile performance so pages stay useful on slower or constrained connections.
Recommendation 2
Check tap targets, menus and text at common phone widths so primary controls are easier to use on mobile.
Recommendation 3
Remediate recurring automated findings such as colour contrast and link names, then confirm improvements with keyboard and zoom checks where practical.
Recommendation 4
Adopt consistent response headers such as HSTS, X-Content-Type-Options, frame protection, CSP and Referrer-Policy as hygiene—not as a substitute for a security assessment.
Recommendation 5
Add clear page titles, meta descriptions, visible primary headings, concise service descriptions and relevant structured data so people and search tools can understand the organization.
Organizations looking at website improvements in the Northwest Territories can also explore website design for NWT organizations—kept here as context, not as a ranking claim.
Methodology
A concise view of the public, non-invasive protocol. Full detail is in the downloadable report.
The aggregate findings are available to read and cite. Reuse requires permission. See the dataset reuse terms.
Limitations and disclosure
These limits are part of the published findings—not footnotes to hide.
About Rovidx
Rovidx Media & Consulting is an Indigenous-owned Northern technology and consulting company. We help organizations modernize websites, improve digital visibility and build practical technology systems suited to Northern realities.
Next step
Book a short call to discuss practical next steps for performance, accessibility, clarity and digital reliability.
A practical conversation—not a sales pitch about this benchmark.